Transportation
Transportation accounts for 55% of GHG emissions for the region. Transportation emissions are generated by on-road vehicles, off-road vehicles and equipment. The amount of emissions in this sector are driven by the relationship of the transportation subsectors, personal transportation choices, the evolution of public transportation, and >off-road contributions.
For more information on the sector see the subsector breakdown and detailed methodology.
Transportation Subsectors
Transportation is made up of a number of subsectors. The movement of people and goods to and throughout the region are captured in this analysis as well as a variety of other activities captured under the off-road subsector.

Passenger vehicles and light-duty trucks account for two thirds of the transportation sector.
Personal Transportation
The total emissions generated by on-road vehicles is a function of the fuel efficiency of the vehicles, the number of trips taken, and the length of the trips. The efficiency of vehicles can be estimated by looking at the mix of vehicles registered on Cape Cod.
The number of length of the trips can be combined into a measure known as vehicle miles traveled (VMT). For the Cape Cod region, the average daily VMT is estimated to be over 8 million miles. This number is high for a region of our size given a number of factors including miles traveled by second homeowners and visitors to the regions, the relatively small proportion of trips in modes other than a personal vehicle, and the geography of the region. If the region had the same per capita VMT rate as the rest of the state, the overall regional VMT would be 30 to 40% less.
Public Transportation
On-road public transportation accounts for less than 1% of emissions within the transportation sector. On a per person basis, travel by public transportation results in far fewer emissions even in diesel-powered vehicles.
The Cape Cod Regional Transportation Authority (CCRTA) provides critical services to all fifteen Cape Cod communities. The CCRTA routes have the capacity to accommodate additional riders by adding few if any new buses on the road. As such, increasing the use of the CCRTA is a highly effective GHG emission reduction strategy. Further investment in the CCRTA and other public transit infrastructure would be beneficial from a GHG emissions perspective as well as an equity perspective serving some of the populations in our region with the greatest mobility needs and challenges.
Off Road
The off-road subsector estimates emissions for non-highway vehicles and equipment. Some of the uses included in the subsector are agricultural equipment (ex. tractors); commercial and industrial equipment and trucks (ex. forklifts); construction equipment and trucks (ex. back hoes); commercial and private lawn and garden equipment; and off-road recreational vehicles.
Sector Data
| MTCO2E | % Total | |
TRANSPORTATION SECTOR TOTAL |
1,979,525 |
55% |
| On Road Subsector | 1,549,771 | 43% |
| Passenger | 991,271 | 28% |
| Light duty | 348,199 | 10% |
| Heavy duty | 193,095 | 5% |
| Motorcycles | 17,206 | 0.5% |
| Air Subsector | 19,614 | 0.6% |
| Commercial | 19,614 | 0.6% |
| Rail Subsector | 918 | 0.03% |
| Cape Flyer | 244 | 0.01% |
| Cape Coastal and Mass Coastal | 674 | 0.02% |
| Ferries Subsector | 49,441 | 1.4% |
| Commercial | 49,441 | 1.4% |
| Off-Road Subsector | 359,781 | 10% |
| Agriculture | 158 | 0.004% |
| Aviation support | 299 | 0.01% |
| Construction | 64,366 | 2% |
| Commercial/Industrial | 146,725 | 4% |
| Lawn and Garden | 61,464 | 2% |
| Pleasure craft | 72,846 | 2% |
| Off-Road Recreation | 6,617 | 0.2% |
| JBCC (All Types) | 7,305 | 0.2% |
Return to Top
Stationary Energy
Stationary energy accounts for 39% of GHG emissions for the region. Stationary energy emissions are generated by the burning of fuel to heat and power homes and commercial/industrials building. The amount of emissions in this sector are driven by the region’s development mix, heating fuel mix, and electricity generation fuel mix.For more information on the sector see the subsector breakdown and detailed methodology.
Development Mix
Development on the Cape is mostly residential, resulting in the highest energy emissions from the residential subsector.
Cape Cod is highly residential, with only 2-3% of the reported commercial/industrial building square footage in the state. This residential development is predominantly single-family homes.
Heating Fuel Mix
A variety of fuel sources are used in homes across the Cape for home heating and the operation of appliances. The largest residential emissions are attributed to natural gas use.
While the number of homes using fuel oil for home heating has decreased, the number of homes using natural gas as a heating source has increased. Today, 59% of residences use natural gas as a heating source. Combined with fuel oil, propane, and electricity, these fuels are used in over 97% of Cape homes for heating.

Energy Generation Fuel Mix
The electricity that powers Cape Cod is generated from a mixture of renewable and non-renewable sources. The electricity generation fuel mix for our region is defined by all of the contributions to the ISO New England Grid.
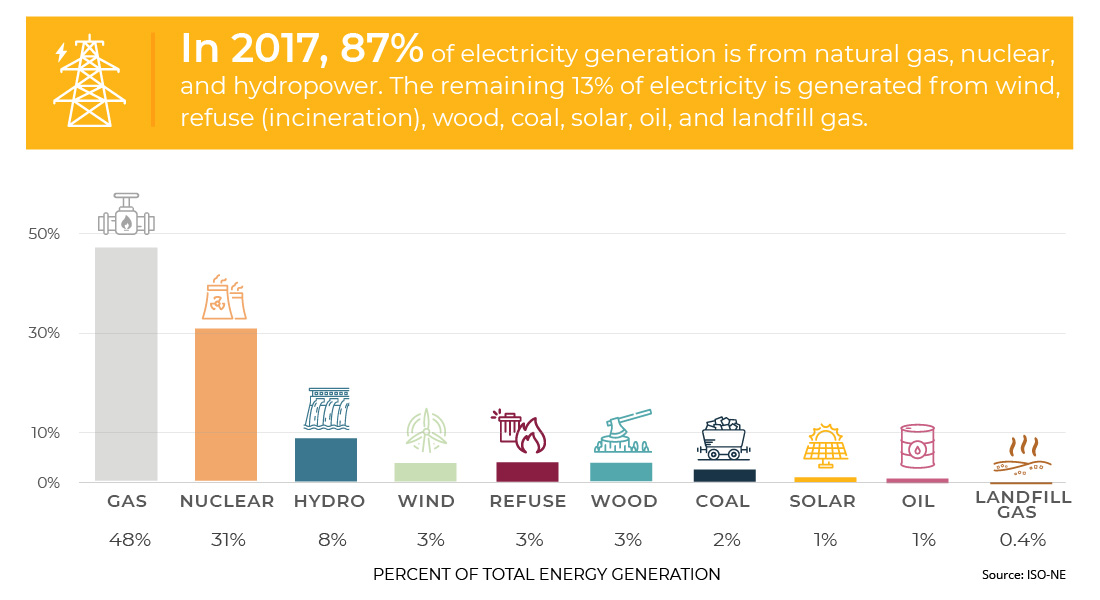
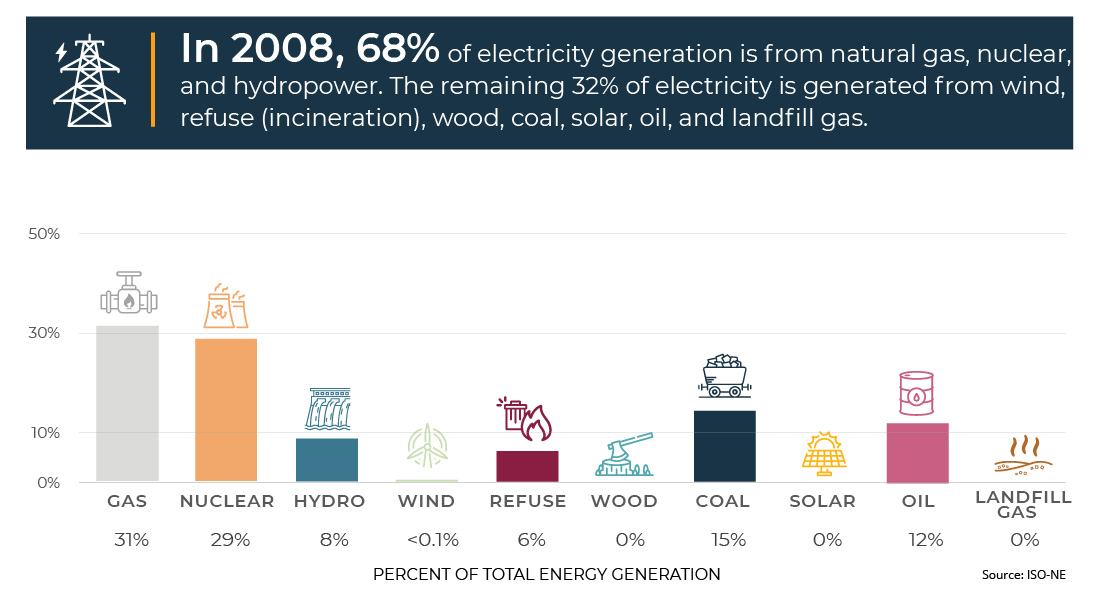
The electricity generation fuel mix has changed significantly over the last decade. With the transition away from oil and the increase in renewable energy sources, the electric grid has become cleaner.
From 2000 to 2017, the proportion of energy generated from renewable sources increased by over 50% from 6% to 9% of the electricity generation fuel mix. The continued development of renewable energy generation in the region is expected to continue greening the grid.
Sector Data
|
|
MTCO2E |
% Total |
STATIONARY ENERGY SECTOR TOTAL |
1,399,477 |
39% |
| Residential Subsector | 947,077 | 27% |
| Electricity | 297,280 | 8% |
| Natural gas | 393,463 | 11% |
| Fuel oil | 223,786 | 6% |
| Propane | 12,548 | >1% |
| Wood | 20,000 | 1% |
| Commercial/Industrial Subsector | 452,400 | 13% |
| Electricity | 237,185 | 7% |
| Natural gas | 174,181 | 5% |
| Fuel oil | 32,812 | 1% |
| Propane | 6,039 | >1% |
| Joint Base Cape Cod (All Fuel Types) | 2,183 | >1% |
Return to Top
Waste
The waste sector accounts for 3% of GHG emissions for the region. This sector includes emissions from solid waste processing and disposal and municipal wastewater treatment.
For more information on the sector see the subsector breakdown and detailed methodology.
Solid Waste Disposal
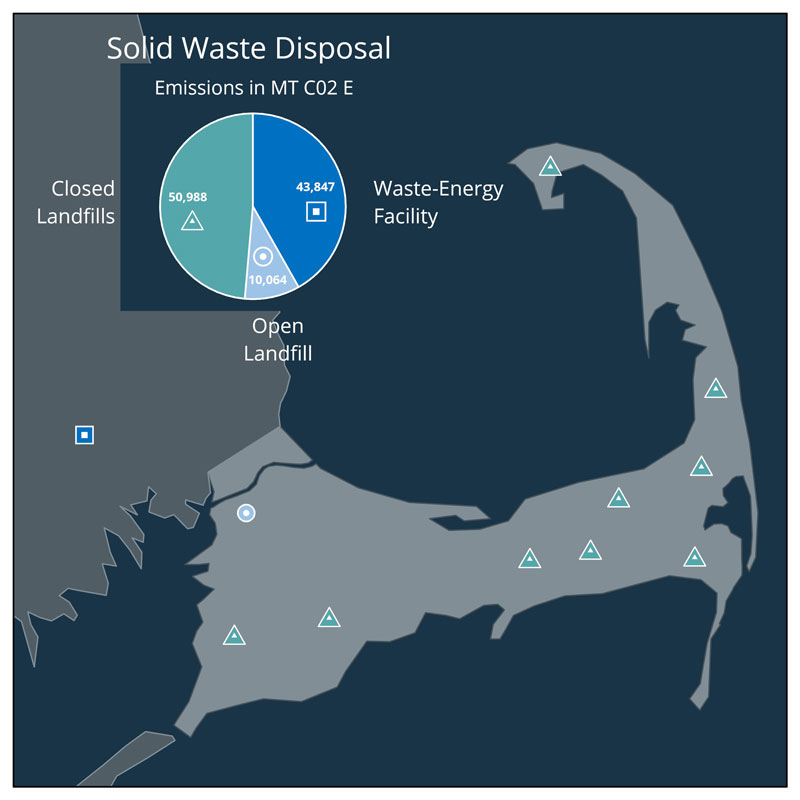
Emissions from solid waste disposal come from closed landfills on Cape Cod, the Bourne Integrated Solid Waste Management Facility, and processing of solid waste from Cape Cod at the Southeastern Massachusetts (SEMASS) Resource Recovery Facility in Rochester. Emissions associated with the transportation of solid waste are accounted for in the transportation sector.
The largest emissions from this sector are from closed landfills. These emissions are expected to decrease over time as organic matter within those landfills continues to break down, decreasing the available organic matter contributing to GHG emissions.
Municipal Wastewater Treatment
Municipal wastewater treatment is a very low emissions source in the region. Emissions related to wastewater treatment processes at these facilities is equivalent to the emissions from energy use of 76 homes for one year.
Sector Data
|
|
MTCO2E |
% Total |
WASTE SECTOR TOTAL |
xx |
3% |
| Solid Waste Subsector | 104,899 | 2.9% |
| Open Landfills | 10,064 | >1% |
| Covanta SEMASS | 43,847 | 1.2% |
| Closed Landfills | 50,988 | 1.4% |
| Wastewater Subsector | 657 | 0.02% |
Return to Top
Industrial Processes and Product Use
The Industrial Processes and Product Use sector accounts for 1.9% of GHG emissions for the region. This sector includes facilities that report GHG emissions to the state GHG Reporting Program, and emissions of sulfur hexafluoride (SF6) associated with electricity system transmission and distribution. While this category covers a variety of facility types, there are few of these facilities on Cape Cod, and there is overall very little industrial processing/production on Cape Cod.
For more information on the sector see the subsector breakdown and detailed methodology.
Facility Types Across the Commonwealth
The types of facilities that report to the Massachusetts GHG Reporting Program can be classified as Institutions, Manufacturing, Natural Gas and Petroleum Infrastructure, Power Generation, Solid and Liquid Waste Management, and several others. Emissions are generally reported from the use of industrial products or processes using industrial products and do not typically include the emissions associated with heating or powering these facilities.

This sector also includes a portion of the state’s SF6 emissions related to electricity system transmission and distribution based on the proportion of the regions electrical use (X%).
Facility Types on Cape Cod
 Historically, there have been approximately 300 facilities in the state that report to the Massachusetts GHG Reporting Program. Of those 300 facilities there are only 4 located on Cape Cod.
The process emissions associated with three of these four facilities are included in this subsector. Process emissions from the fourth facilities, the Bourne Landfill, are accounted for in the waste sector.
Regional Economic Sectors
There is minimal industrial processing/production on Cape Cod. The economy is tourism-focused with a high proportion of small businesses. Light industrial activity accounts for a small portion of the overall regional economy.
Sector Data
|
|
MTCO2E |
% Total |
Industrial Processes and Product Use |
66,093 |
2% |
| MA Greenhouse Gas Reporting Program | 63,669 | 1.8% |
| Cape Cod Hospital | 6,610 | 0.2% |
| WHOI | 3,718 | 0.1% |
| Canal Generating Plant | 53,341 | 1.5% |
| Bourne Landfill (reported in Waste Sector) | -- | -- |
| Electricity Distribution (SF6 emissions) | 2,424 | 0.1% |
Return to Top
Agriculture and Soil Management
The Agriculture and Soil Management sector account for 0.4% of GHG emissions for the region. This sector accounts for emissions generated from fertilizer use across all land uses in the region and the emissions associated with other agriculture activities.
For more information on the sector see the subsector breakdown and detailed methodology.
Soil Management
The largest contribution to this sector comes from fertilizer use. The amount of emissions from fertilizer use is based on the acreage of different land uses across the region and the fertilizer application rates for those land uses.

Agriculture
There are approximately 300 farms on Cape Cod covering approximately 4,250 acres. Most farms are small in size with an average size of about 14 acres. Cranberry bogs, wood lots and tree farms tend to be some of the largest. Emissions from farms tend to be fairly small and some farm types, such as cranberry bogs, have the potential for some carbon sequestration.

Agriculture production on Cape Cod allows for food to stay local and reduce emissions related to the regional imports of farm products.
Sector Data
|
|
MTCO2E |
% Total |
AGRICULTURE SECTOR TOTAL |
15,153 |
0.4% |
| Livestock | 2,769 | 0.1% |
| Soil Management | 12,384 | 0.3% |
Return to Top
Land Use, Land Use Change, and Forestry
Land management and disturbance can impact the natural environment. Natural land, including vegetated areas and soils, can sequester or emit carbon based on land management practices like vegetation removal or soil disturbance. Carbon sequestration is the process of vegetation and soils absorbing carbon instead of emitting it.
This sector includes emissions and sequestration from forestland, cropland, and grassland. Due to limited land management of these areas, the land use sector can sequester 9% of the Cape's total carbon emissions.
For more information on the sector see the subsector breakdown and detailed methodology.
Sequestration
Net carbon sequestration, or storage, was calculated in the land use sector. The natural process of plants and soils absorbing CO2 leads to carbon sequestration.

In these areas of Cape Cod, forestland has the most potential for carbon sequestration, able to absorb 20% of on-road vehicle transportation emissions. Wetland ecosystems also have the potential to sequester large amounts of carbon.
Carbon Story Map
Commission staff have been receiving numerous requests for data and technical assistance from towns, conservation organizations, and others to aid them in conducting their own localized carbon accounting, with a particular focus on the carbon storage and sequestration potentials of local forests and wetlands. To assist these entities in their efforts, the Commission is working on a Carbon StoryMap that will provide users with valuable, high-resolution data on land cover classes on Cape Cod, references to carbon estimates for different land cover classes including descriptions of the uncertainties and assumptions surrounding these estimates, and other carbon accounting resources. With this information, interested parties will be better positioned to understand and estimate the carbon storage and sequestration potential of their area of interest. This StoryMap is expected to be available in winter 2021-2022.
Land Use
86% of the region’s land area is already protected or developed, with over 90,000 acres of protected open space.
Between 2001 and 2011, the Cape lost more than 2,300 acres of forest cover, with 70% of the loss replaced by development (buildings, driveways, parking lots, etc.). Focusing future development in Activity Centers and away from areas that are undeveloped can help maintain our region’s ability to sequester carbon in natural areas.
Sector Data
|
|
MTCO2E |
% Total |
LAND USE SECTOR TOTAL |
-340,582 |
-9.6% |
| Forestland | -337,657 | -9.5% |
| Grassland | 79 | >1% |
| Cropland | -3,004 | -0.1% |
Return to Top