The Cape Cod Commission periodically surveys residents to understand current perspectives. In winter 2025, the Commission worked with the UMass Lowell survey team and the University of Massachusetts Donahue Institute (UMDI) to conduct a survey of Cape Cod residents to better understand resident perspectives and priorities towards a variety of planning and development issue areas facing the region both now and in the future. Several questions in the 2025 survey share similar themes or are directly repeated from the previous Cape Cod Homeowner Survey conducted by UMDI in 2014. The 2025 survey includes statistically significant responses from full-time and part-time residents, homeowners, and renters. Survey findings will help inform updates to the Cape Cod Regional Policy Plan (RPP) being undertaken in 2025.
Who responded?
 More than 1,200 people completed the survey. Slightly more than half of respondents identified as male, with 44% identifying as female, and 3% selecting other responses. Respondents were also relatively older, with 63% aged 65 years or older, and 95% identified as white. More than half (56%) reported an annual household income of $100,000 or more and more than half (57%) also reported being retired.
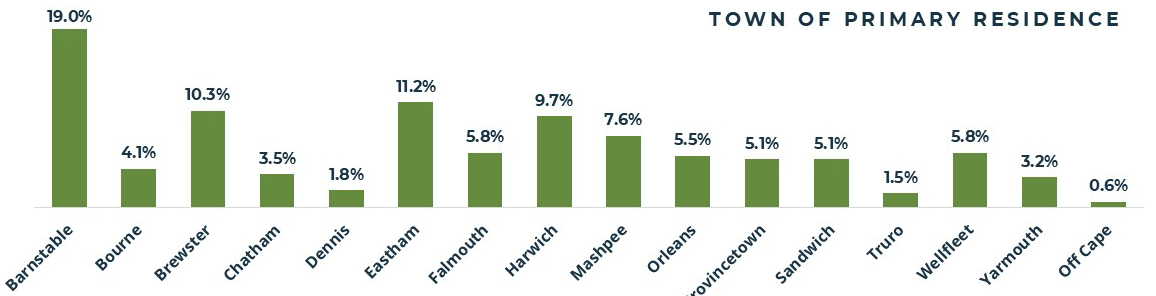
People responded from all Cape towns, with a few responding whose primary residence is Off-Cape. While these are who responded, the results from the responses were weighted to be representative of the Cape Cod population as a whole.
Why do they live here?
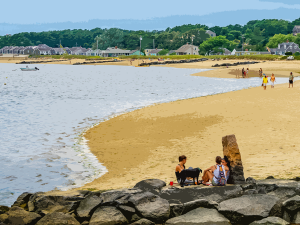
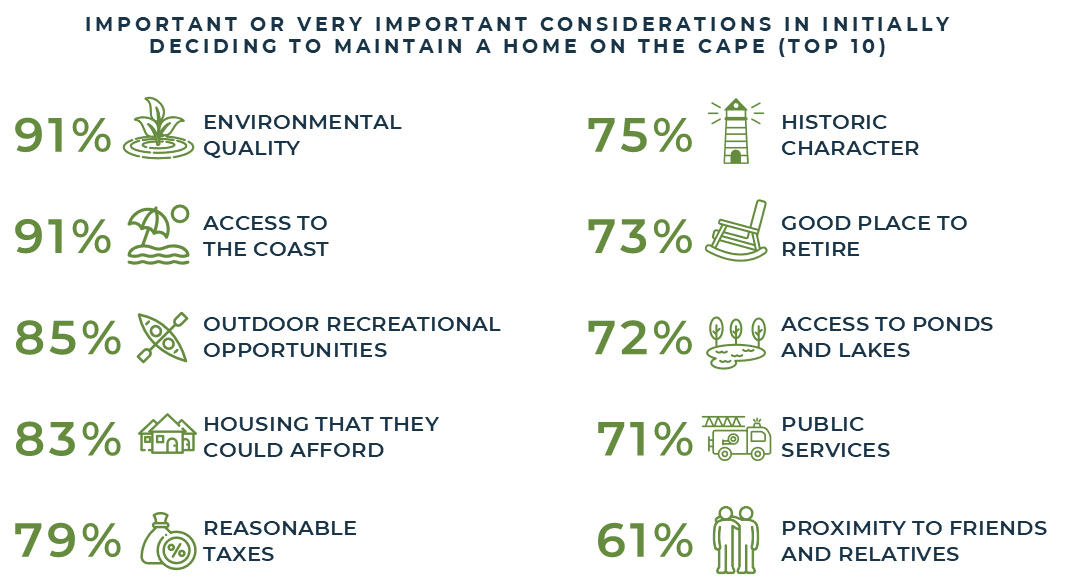
Environmental quality, access to the coast, and outdoor recreational opportunities continue to be important factors for individuals deciding to live or maintain a residence on the Cape. Eighty-five percent of respondents identified outdoor recreational opportunities as important or very important, and environmental quality and access to the coast were both identified as important or very important by 91% of respondents.
Current and Future Challenges
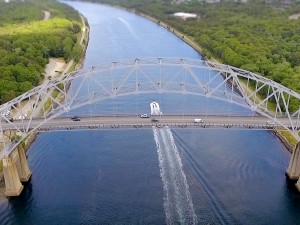
Residents were asked to consider several factors and indicate the extent to which they think it is a problem for their town now or in the next five years. 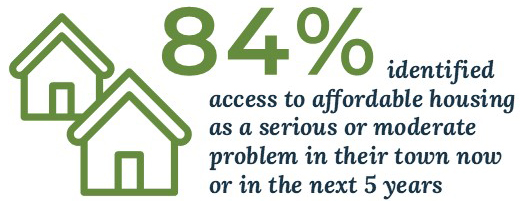 The top factors identified as either a moderate or serious problem were availability of affordable housing (84.0%), coastal erosion (83.3%), traffic congestion (81.1%), sea level rise (75.9%), and pond water quality (73.9%). Notably, residents living in the Outer Cape region disproportionately identified healthcare facilities as an issue, with 82.3% rating adequacy of healthcare facilities as a moderate or serious problem in their town now or in the next five years compared to the overall average of 65.9% across all Cape regions.
Housing Needs
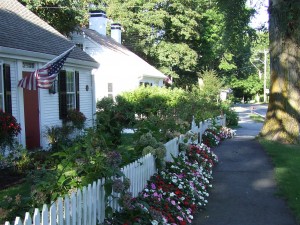
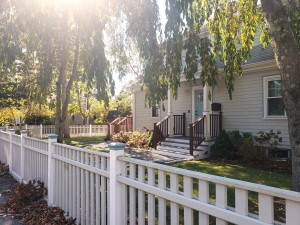
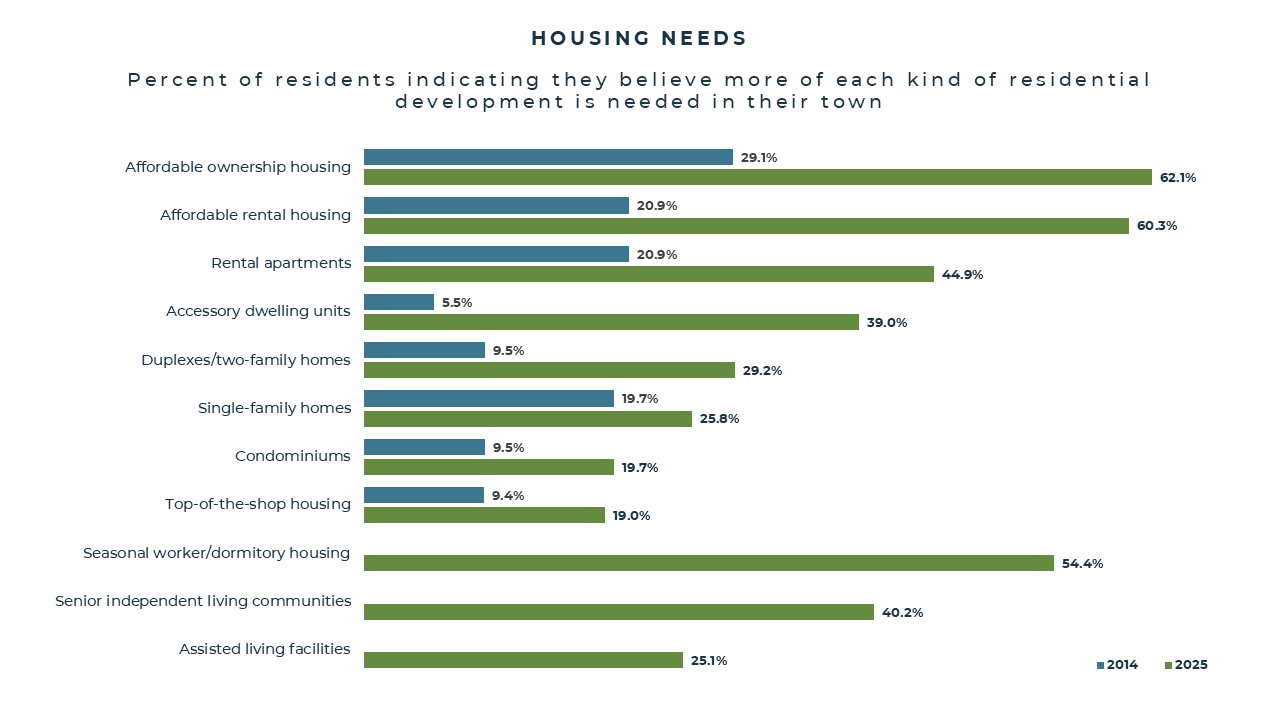
The survey also asked residents whether they thought more of certain kinds of housing were needed in their town. More than 60% of residents believe that more affordable ownership and rental housing are needed in their town, and more than half believe that seasonal worker/dormitory housing is needed. Housing priorities vary significantly from region to region, with over 70% support for affordable and worker housing in the Outer Cape, compared to 53% support for affordable housing in the Mid-Cape and under 40% support for worker housing in the Upper Cape. Support for all types of housing has grown over the past decade, with most categories at least doubling their support from 2014. The biggest increases were in affordable ownership housing, which went from 29% in 2014 to 62% in 2025; affordable rental housing, which went from 21% to 60%; and auxiliary dwellings/ADUs, which went from 6% to 39%.
Support for Infrastructure Projects
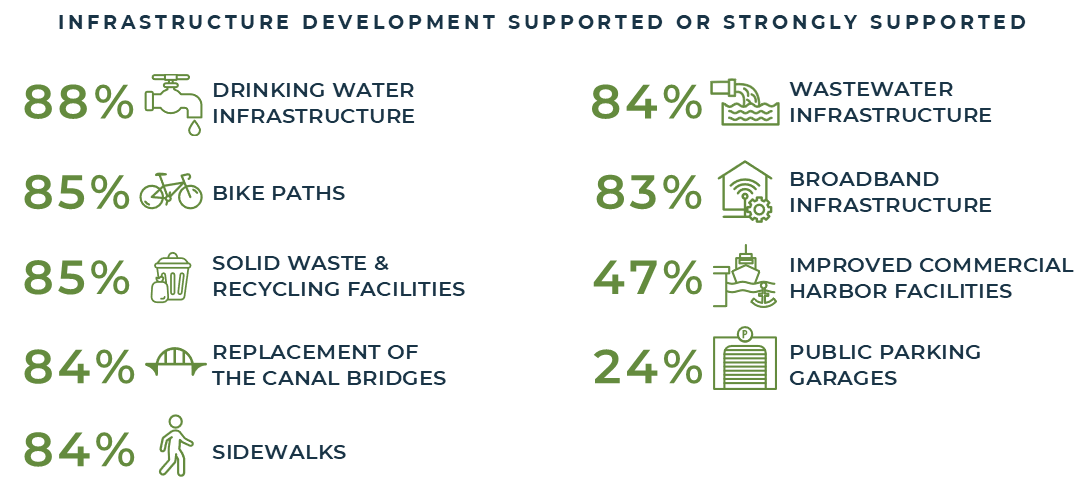
Similar to past surveys, this one also asked residents which infrastructure development they would support. Eight of the ten options received overwhelming support with more than 80% of residents indicating they would either support or strongly support them. Overall, support was greatest for drinking water infrastructure (88.2%) and bike paths (85%) and there was the lowest amount of support towards the potential development of public parking garages (23.7%).
More detail, including additional questions, the entire survey itself, and responses by subregion are available in the report.
Contact
-
Chloe Schaeferchloe.schaefer@capecodcommission.org
-
Erin Perryeperry@capecodcommission.org