Understanding Cape Cod’s greenhouse gas emissions
On Cape Cod, greenhouse gas emissions come from many everyday activities. Driving to work, school, or the grocery store; heating homes and businesses; operating construction equipment and lawn mowers; boating; and disposing of trash all produce emissions. Refrigerants used in air conditioners and similar equipment also contribute.
Together, these activities create a measurable greenhouse gas footprint. Understanding where those emissions come from can help communities identify opportunities to reduce them and make informed decisions about local climate action.
The Cape Cod Commission has worked with four towns across the region to develop local greenhouse gas emissions inventories. Working with a consultant, the Commission first completed an inventory for Eastham. That approach has since been used in Falmouth, Orleans, and most recently, Chatham.
Greenhouse gas inventories estimate emissions from activities within a community and organize them into major sectors. They provide a baseline for understanding local emissions, identifying significant sources, and tracking progress toward greenhouse gas reduction goals.
Greenhouse gases--including carbon dioxide, methane, and nitrous oxide--naturally retain heat in the atmosphere. Human activities, particularly burning fossil fuels, changing land use, and industrial processes, have increased their concentrations in the atmosphere and contributed to climate change.
Understanding local emissions
The municipal inventories examine emissions across five sectors: stationary energy, transportation, waste, industrial processes and product use, and agriculture and land management. They follow established greenhouse gas accounting standards and account for the different warming effects of individual greenhouse gases and have been designed to be consistent with the Cape Cod Greenhouse Gas Emissions Inventory.
Developing an inventory requires combining information from local, regional, and state sources. When town-specific information is unavailable, broader datasets may be consulted, using factors such as population, building area, or land type. The inventories document these assumptions and limitations, recognizing that results are estimates based on the best available data.
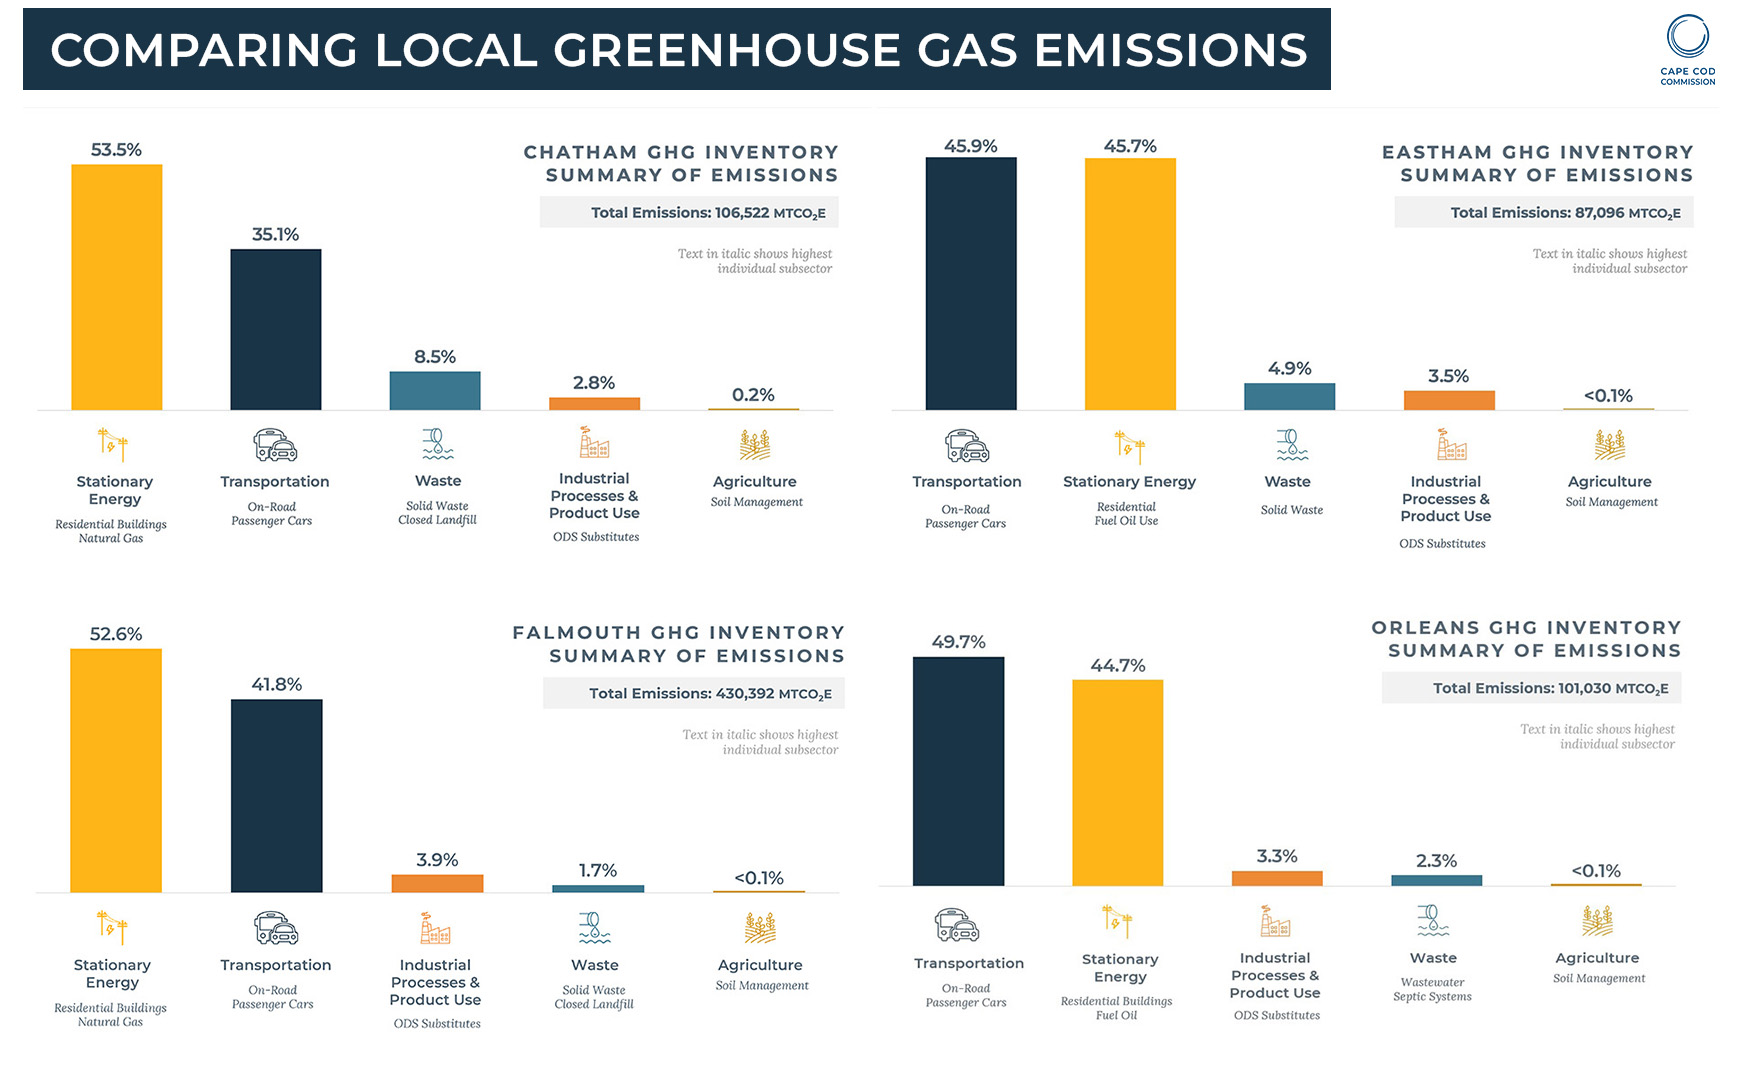
Across all four communities, stationary energy and transportation account for the majority of greenhouse gas emissions, although their relative proportions vary by town.
Stationary energy includes electricity and fuels such as natural gas, fuel oil, propane, and wood used in residential, commercial, and municipal buildings (as applicable to each individual community). Transportation emissions include on-road vehicles as well as other forms of transportation, including off-road vehicles and equipment such as construction equipment and recreational marine use.
Other differences reflect local characteristics: Falmouth, for example, has a larger share of emissions from commercial energy use and water transportation, while on-road transportation plays a particularly significant role in Orleans. Waste accounts for a much smaller portion of emissions overall.
These variations showcase the value of developing inventories at the municipal level. Although Cape Cod communities share many of the same major emissions sources, each town has a different emissions profile, and therefore different opportunities for reducing emissions.
From data to local action
An emissions inventory is more than an accounting exercise. By establishing a baseline and identifying major sources of emissions, it can help a community determine where to focus its efforts and which climate strategies may be most appropriate for local conditions.
The Cape Cod Climate Action Plan provides a regional framework for reducing greenhouse gas emissions and building climate resilience. Following its adoption, the Commission developed a Municipal Climate Action Toolkit outlining 15 priority actions communities can consider, along with implementation steps and information about available resources and funding.
Many of those actions address the same sectors measured through greenhouse gas inventories, including transportation, energy, and land use. While the Climate Action Plan identifies strategies that can be advanced across Cape Cod, a municipal inventory helps a town understand which emissions sources are most significant within its own borders and tailor its approach accordingly.
Eastham provides an early example. After completing its greenhouse gas emissions inventory, the town used the findings to inform development of its local climate action plan and help identify priorities for local action.
Chatham is beginning a similar process. Following a presentation by Commission staff, the town’s Energy and Climate Committee discussed using the inventory to help update the town’s climate roadmap, establish priorities, communicate findings, and align local efforts with the regional Climate Action Plan.
Greenhouse gas inventories are one component of broader climate planning efforts, but they provide communities with an important starting point. By identifying where emissions originate and establishing a measurable baseline, inventories can help Cape Cod towns turn regional climate action into locally informed priorities and track progress over time.
Related Posts