Traffic trends on Cape Cod have changed dramatically as a result of the COVID-19 pandemic
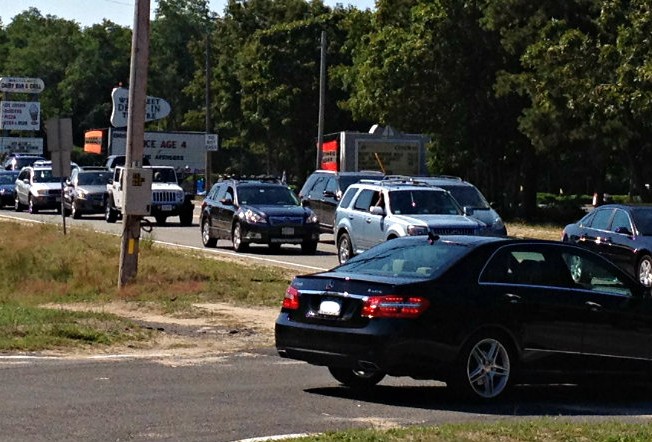
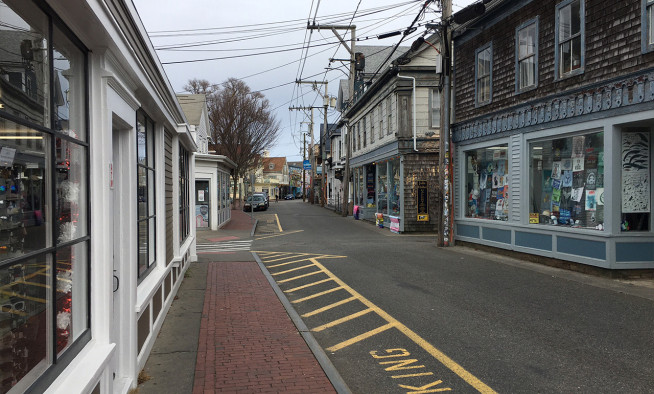
Busy roadways are a typical part of summers on Cape Cod, with visitors coming in droves to enjoy the region. But due to the COVID-19 pandemic, this summer is anticipated to be different.
Cape Cod Commission staff tracks traffic patterns and trends across the Cape, keeping an eye out for high-congestion areas, crash-prone sites, and looking for places to make improvements.
In addition to normal traffic tracking work, this year Commission staff has been taking a look at impacts to traffic related to the pandemic.
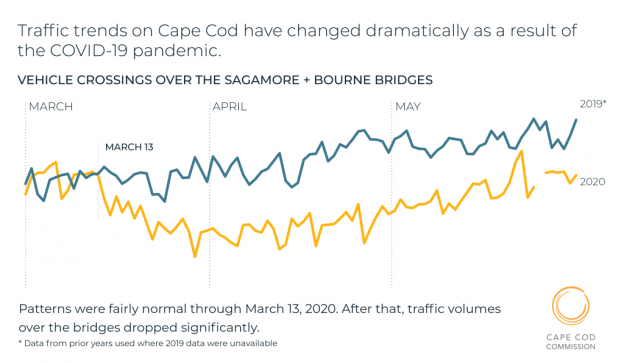
Staff began to see traffic patterns change following Governor Baker’s announcement in mid-March that offices, businesses, and schools were to close. Through March 13, 2020 traffic patterns over the Bourne and Sagamore bridges were fairly normal. Following the Governor’s announcement, traffic volumes over both bridges dropped significantly.
The downward trend continued through the month of April. Traffic volumes over the Bourne and Sagamore bridges were down 48 percent compared to the previous year. Traffic counters installed at several key locations saw changes as well: a 47 percent drop on Route 6 eastbound east of Exit 5, a 25 percent drop at Route 124 and Queen Anne Road in Harwich, a 40 percent drop at the Wellfleet/Eastham town line, and a 38 percent drop at Route 28 and Lumbert Mill Road in Barnstable.
Residents and visitors alike know that Memorial Day Weekend is famous for its long lines heading on Cape on Friday and Saturday, and congestion heading off Cape on Sunday and Monday. While traffic trends over the holiday weekend can vary due to a number of factors, including weather, the numbers in 2020 show a significant drop over previous years. Over the holiday weekend, travel over the Bourne and Sagamore bridges was down 22 percent on Friday, 35 percent on Saturday, and 28 percent on Monday.
May numbers, while still down, show improvement. Traffic over the bridges was down 31 percent in May, and 15 percent in June (as of 6/22). Trends are similar across the region, heading back towards normal volumes.
Commission staff continues to track traffic trends as we head into what is typically the busiest time of year on Cape Cod. Traffic counters have been installed, and for the first time the Commission is tracking bicycle traffic on the Cape Cod Rail Trail.
Explore the latest traffic numbers
The Cape Cod COVID-19 Data Dashboard provides traffic data and other demographic and economic data related to the impacts of the pandemic on Cape Cod. Visit www.datacapecod.com.
